Manually reproducing issues slows everyone down—so we re‑imagined the process, making it effortless and delightfully fast.
How It Works
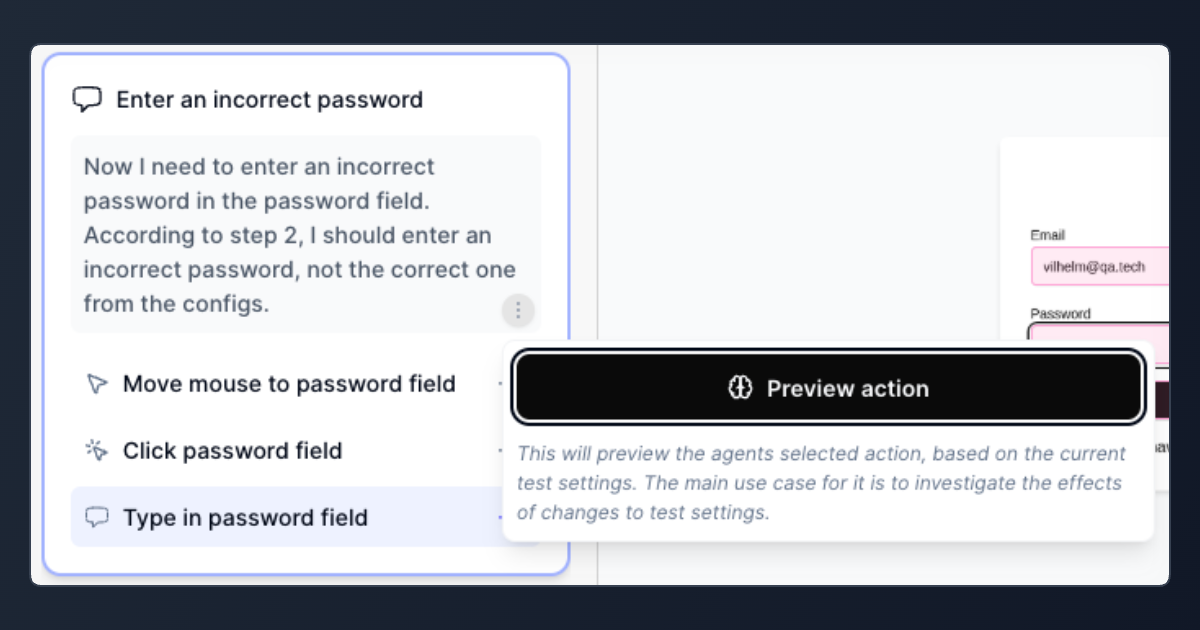
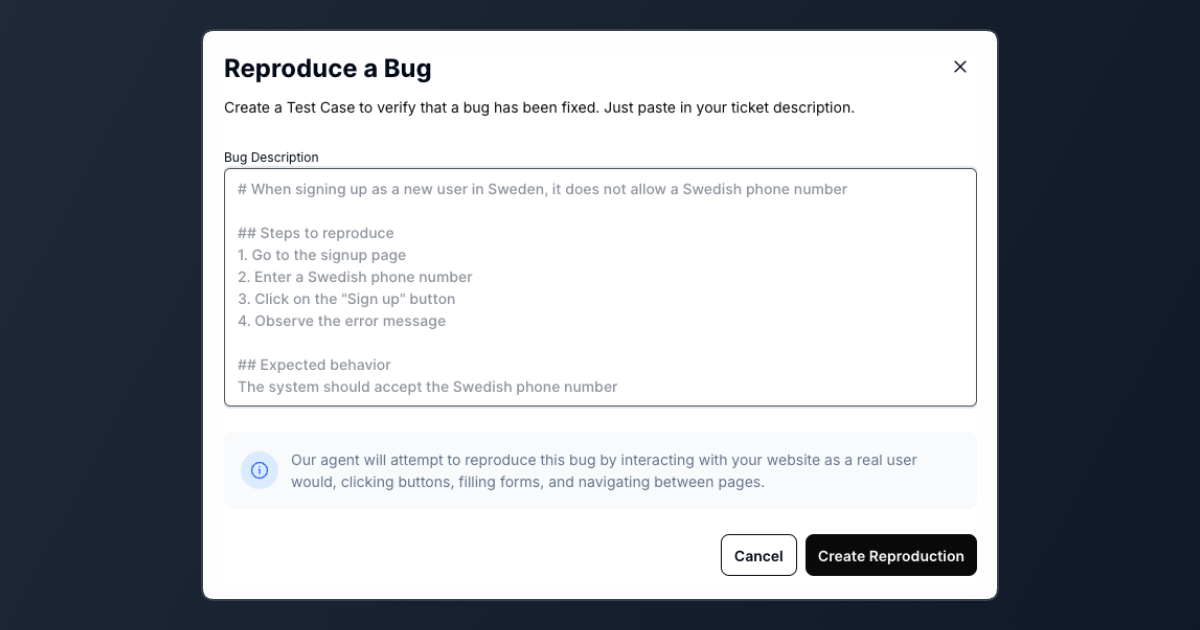
Simply describe the bug—like “Incorrect phone number in sign up doesn’t give a validation message” or “No email when trying to reset password”—and let our AI take care of the rest.
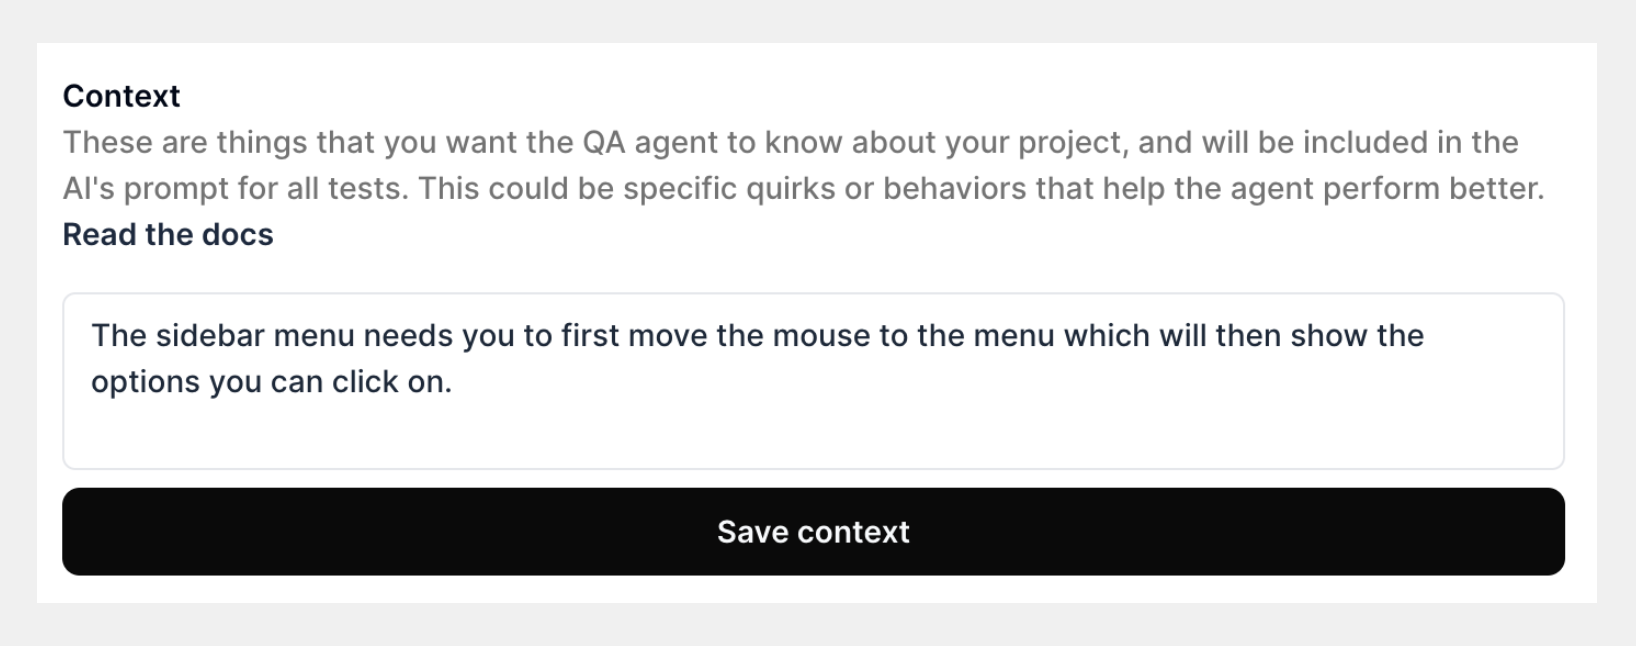
- Analysis: The AI carefully reviews your bug description, checking it against existing tests and your project-specific context.
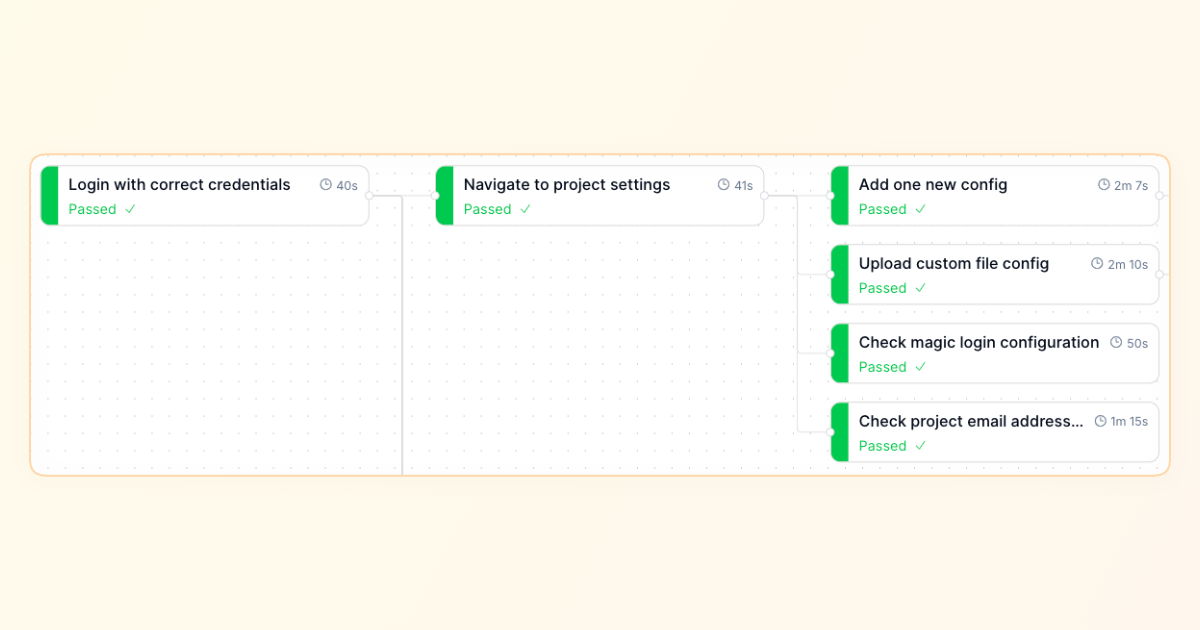
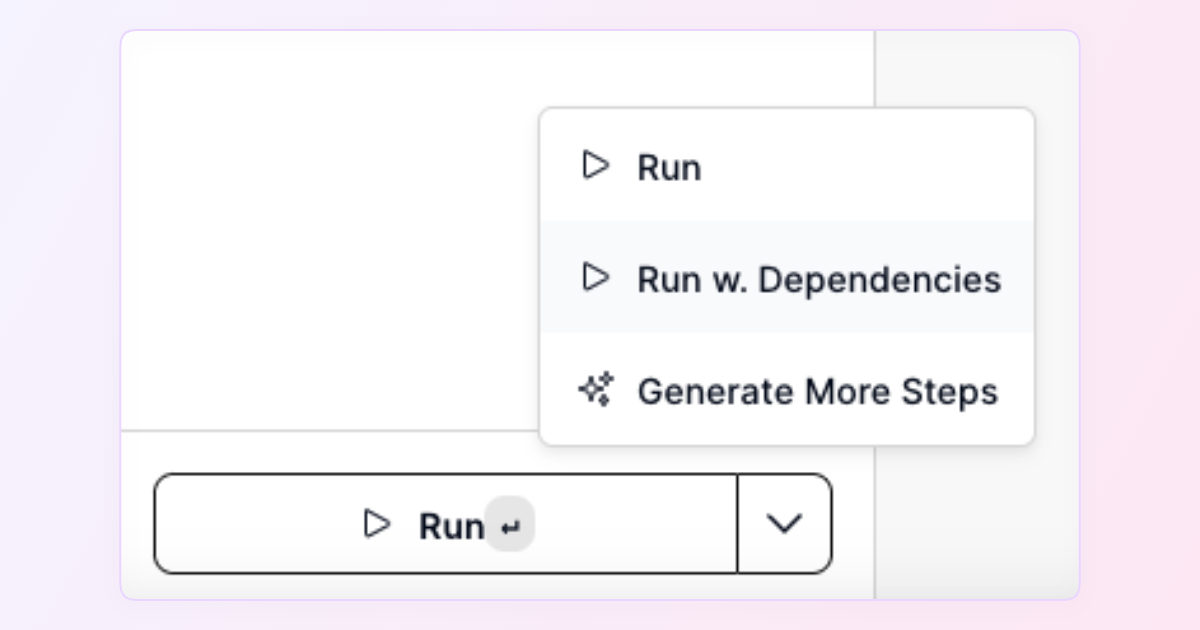
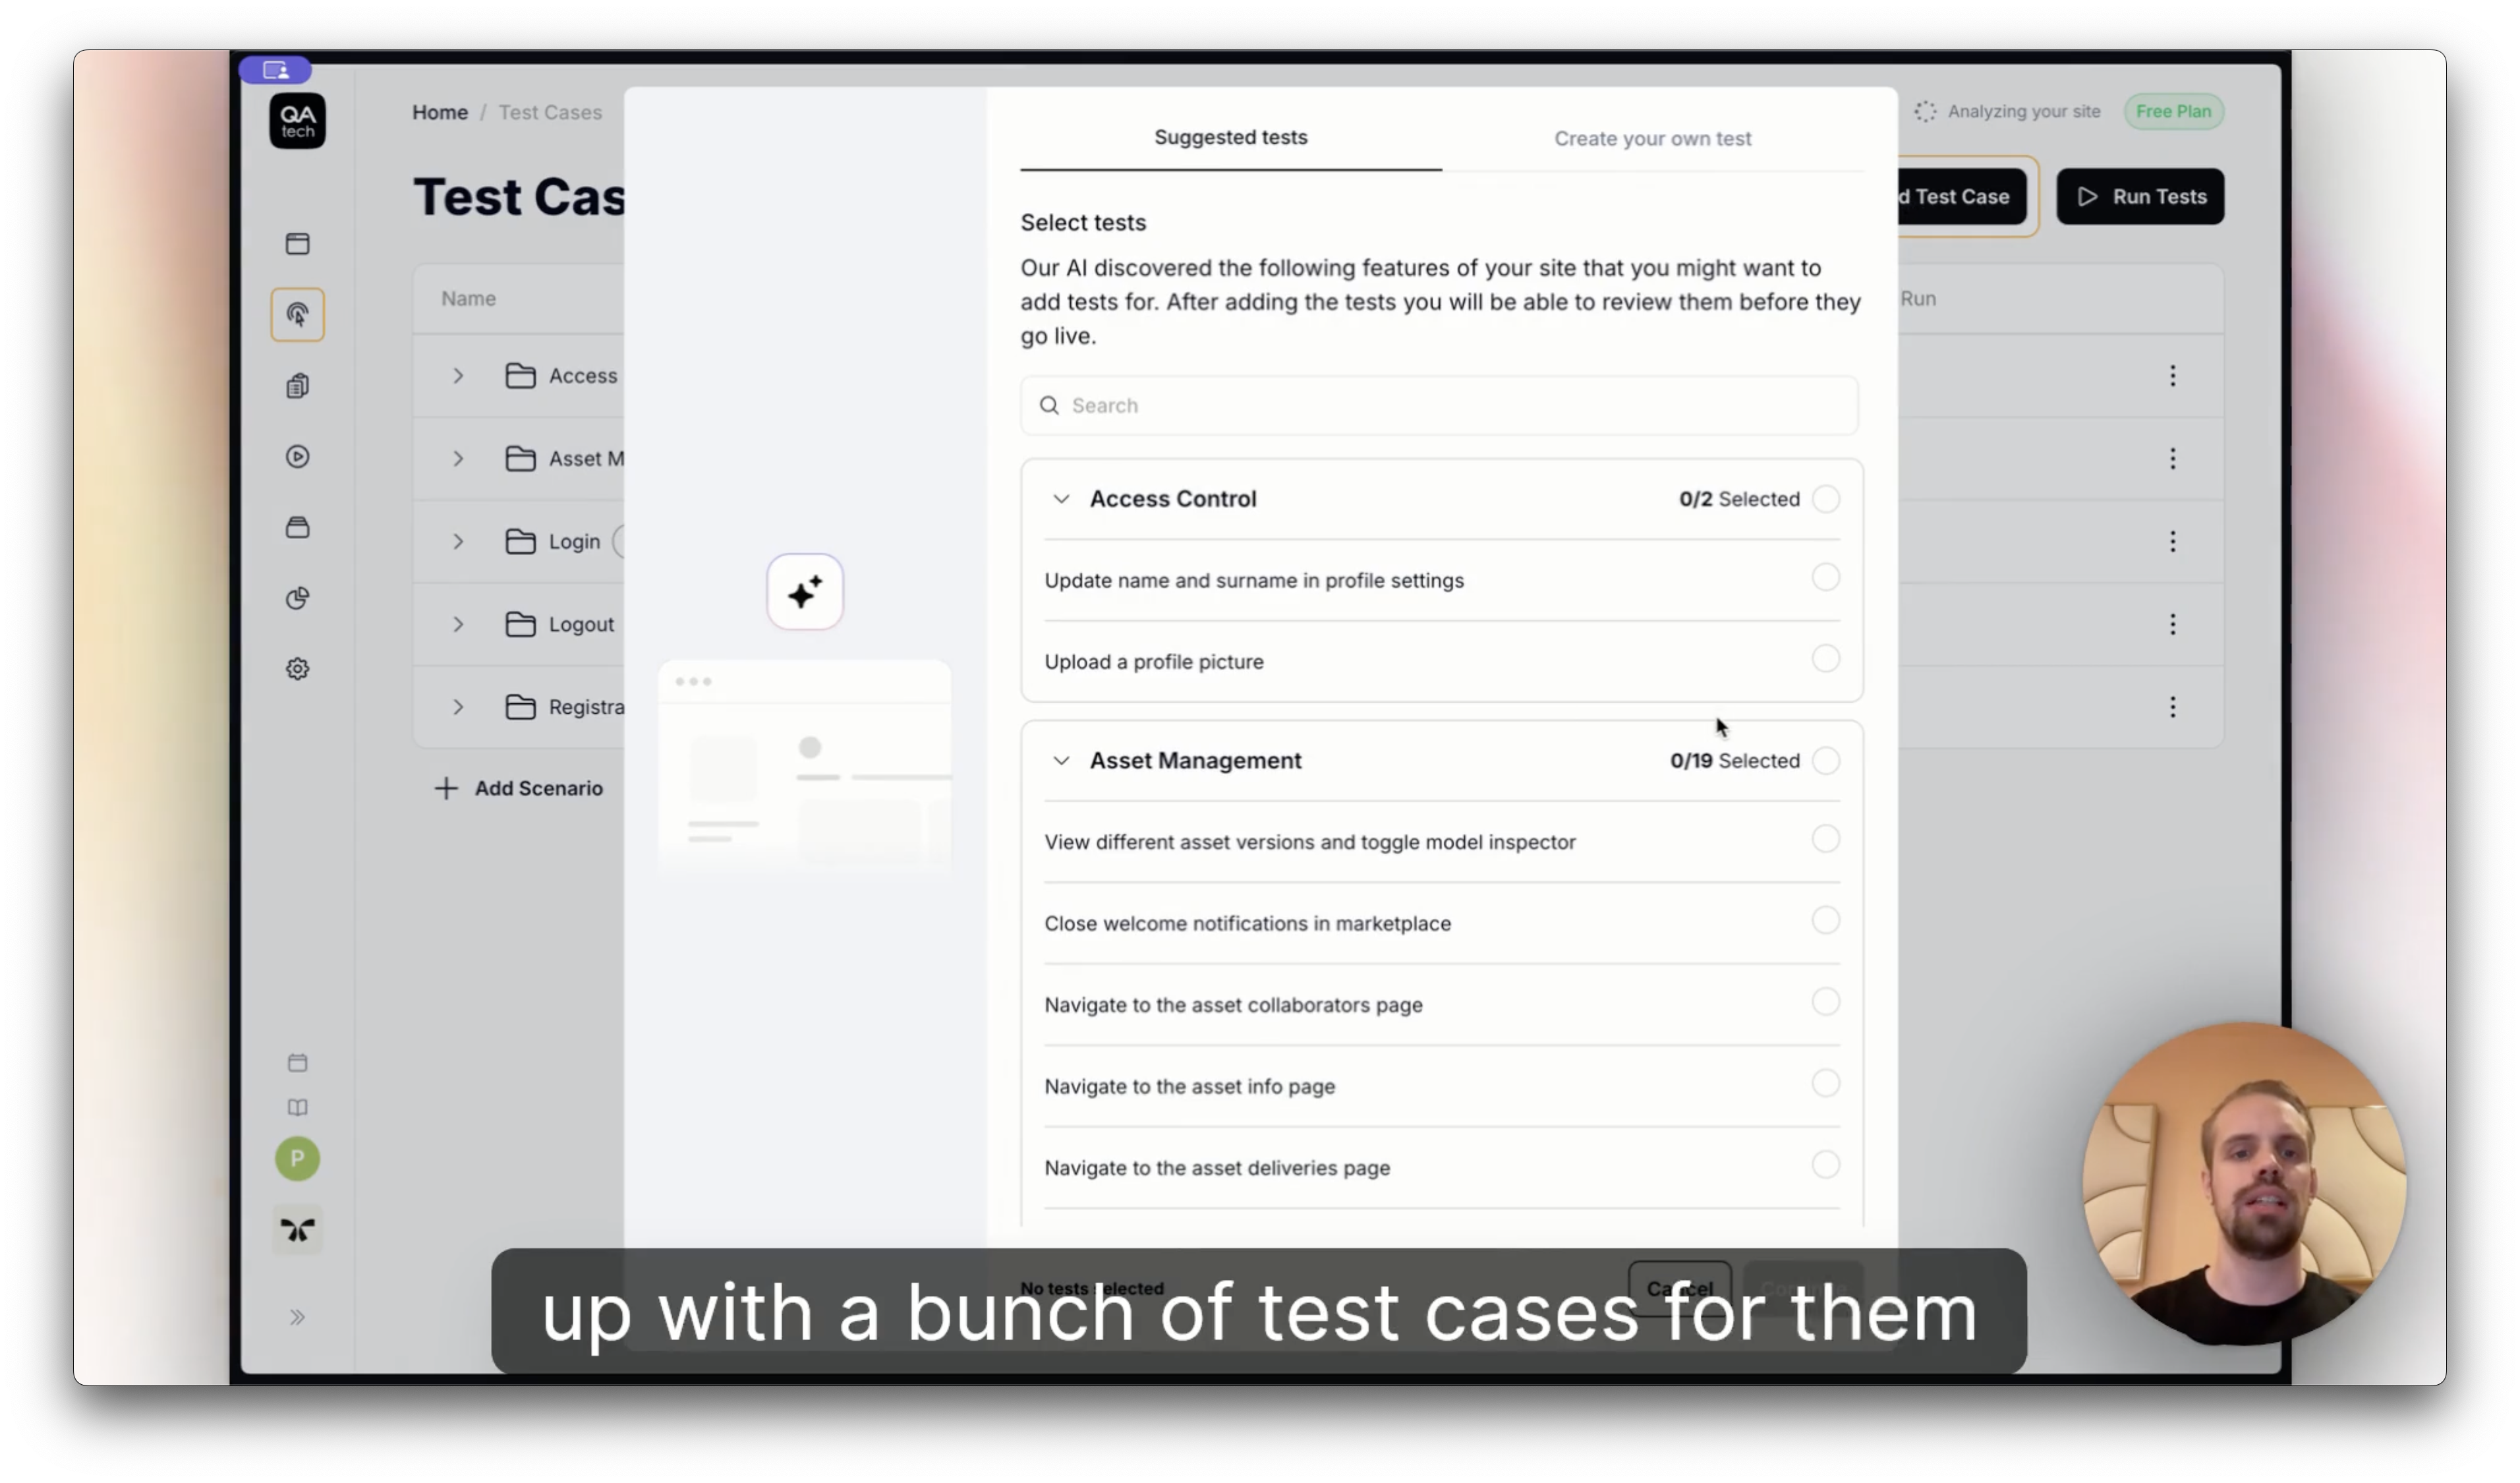
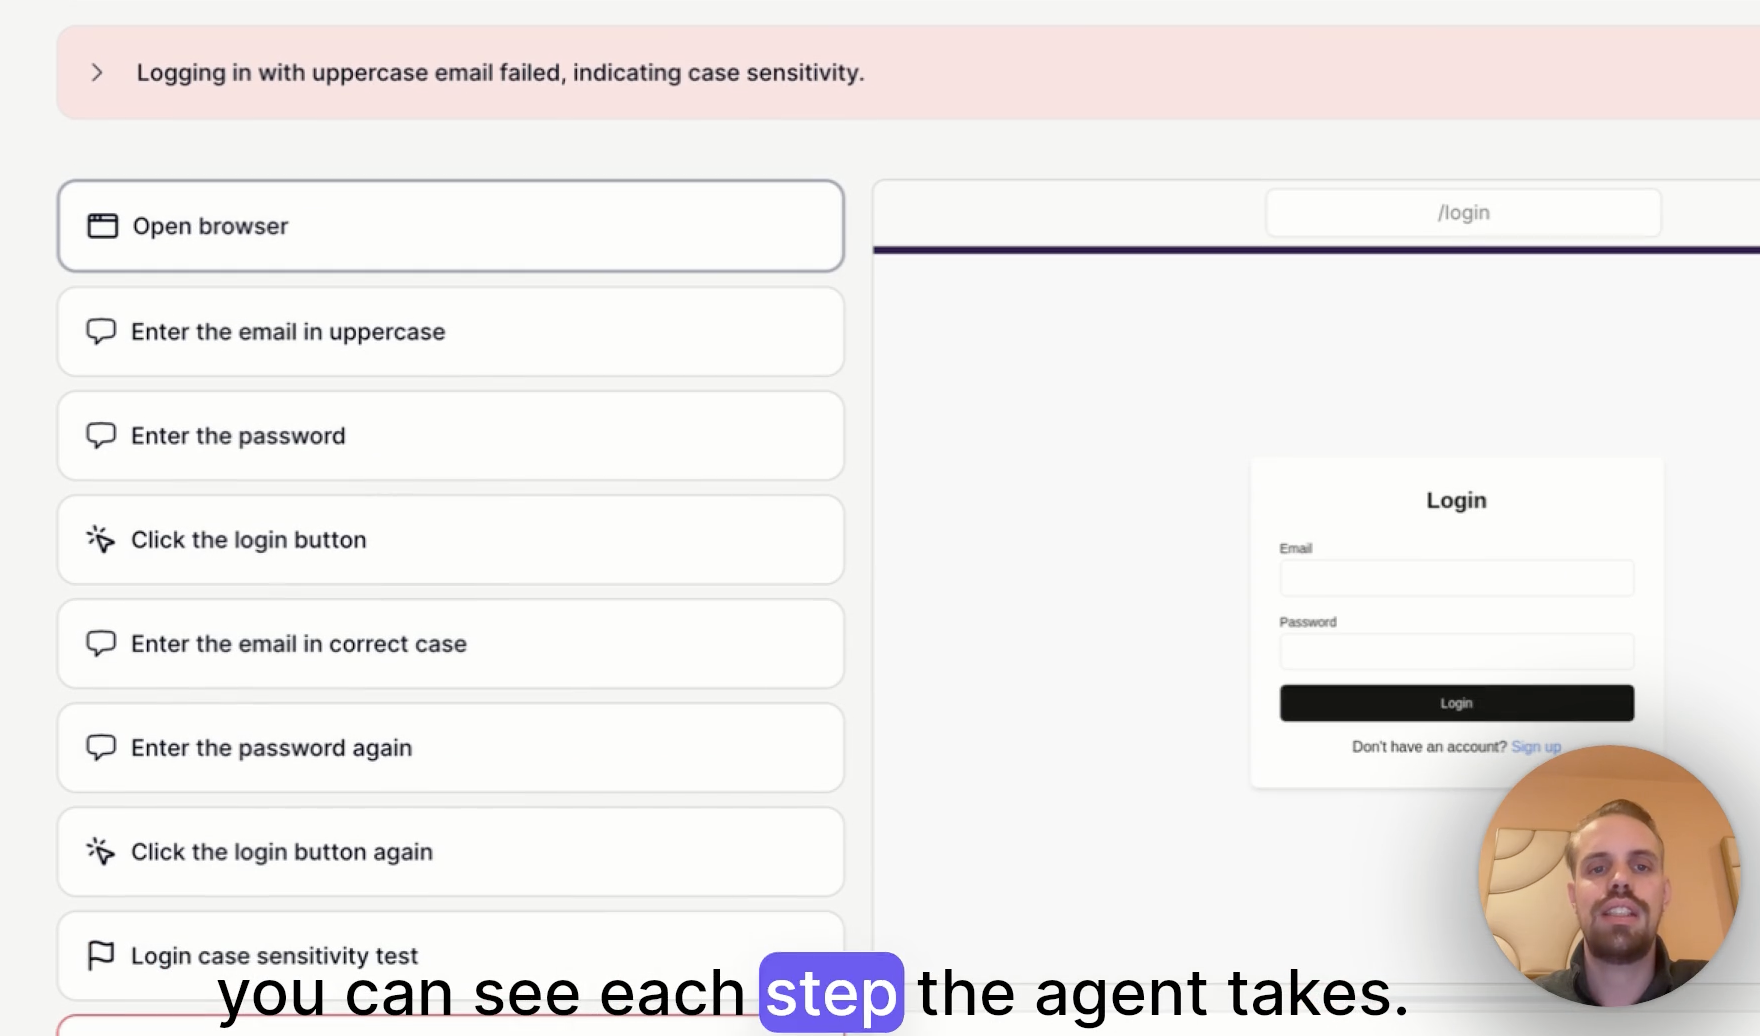
- Test Generation: It then automatically creates the perfect test case tailored precisely to reproduce your bug.
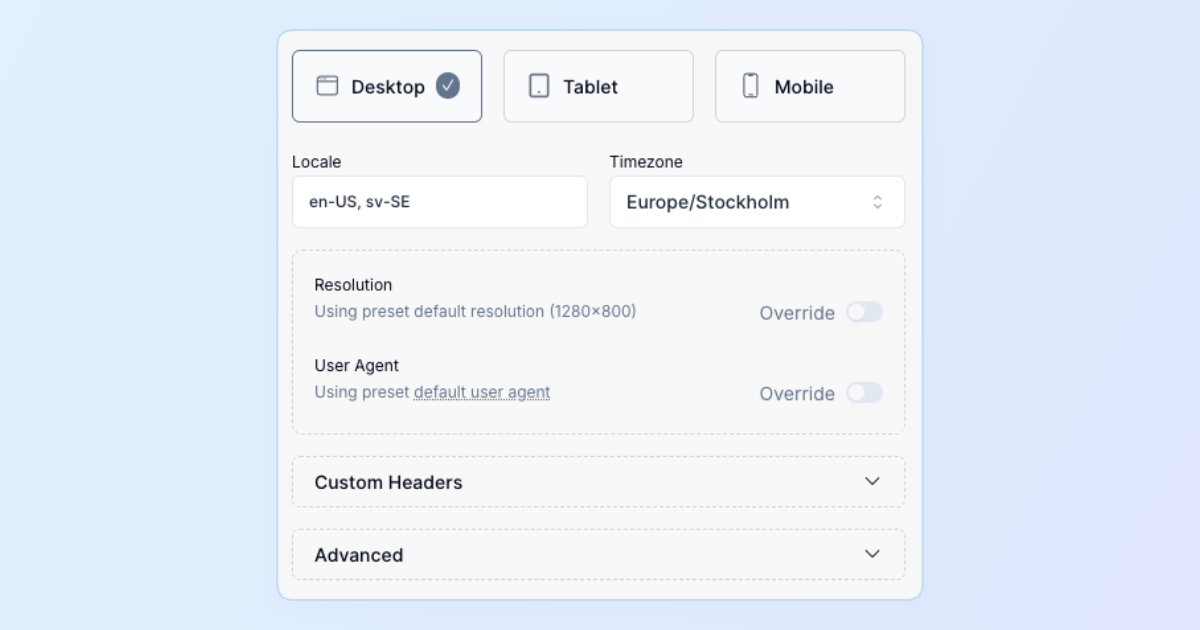
- Execution Plan: Finally, the AI builds a smart testing plan, determining exactly what’s needed—such as login credentials, specific navigation steps, or special conditions—to successfully replicate the issue.
Say goodbye to repetitive bug reproductions. With our AI-powered approach, finding and fixing issues is faster, simpler, and more efficient.