'%3e%3cpath%20d='M24.91%2020.362h-.018c.003-.121.018-.24.018-.362%200-6.86-5.582-12.422-12.468-12.422C5.557%207.578-.026%2013.14-.026%2020s5.582%2012.422%2012.468%2012.422c2.518%200%204.857-.75%206.817-2.029v6.585L24.91%2040zM19.262%2020c0%203.753-3.053%206.795-6.82%206.795-3.766%200-6.82-3.042-6.82-6.795s3.054-6.795%206.82-6.795%206.82%203.042%206.82%206.795M88.277%200l-5.65%203.022v6.585a12.44%2012.44%200%200%200-6.818-2.029C68.923%207.578%2063.34%2013.14%2063.34%2020s5.582%2012.422%2012.468%2012.422S88.277%2026.86%2088.277%2020c0-.122-.015-.24-.019-.362h.019zM75.809%2026.795c-3.767%200-6.82-3.042-6.82-6.795s3.053-6.795%206.82-6.795c3.766%200%206.82%203.042%206.82%206.795s-3.054%206.795-6.82%206.795m-43.555-8.566v14.193h-5.65V18.229c0-6.888%204.342-10.52%2010.56-10.52h.968v5.539h-1.068c-2.992%200-4.81%201.826-4.81%204.981'/%3e%3cpath%20d='M62.044%2020c0-6.86-5.583-12.422-12.469-12.422S37.107%2013.14%2037.107%2020s5.582%2012.422%2012.468%2012.422c4.61%200%207.339-.86%2010.512-3.856l-4.261-3.708c-2.801%203.022-10.79%203.048-12.695-2.648h18.704c.13-.719.209-1.455.209-2.21m-18.832-2.786c1.21-2.75%203.678-4.168%206.354-4.168s5.188%201.469%206.382%204.168zm48.334%2015.208A3.45%203.45%200%200%200%2095%2028.98c0-1.9-1.546-3.44-3.454-3.44a3.45%203.45%200%200%200-3.454%203.44c0%201.9%201.546%203.442%203.454%203.442'/%3e%3c/g%3e%3cdefs%3e%3cclipPath%20id='clip0_9001_21'%3e%3cpath%20fill='%23fff'%20d='M0%200h95v40H0z'/%3e%3c/clipPath%3e%3c/defs%3e%3c/svg%3e)
'%3e%3cpath%20fill='%234d4e50'%20d='M25.352%2023.862c0%205.373-3.47%208.292-10.157%208.292H.422c-.254%200-.423-.17-.423-.423V3.342c0-.254.17-.423.423-.423h13.29c6.053%200%209.989%202.581%209.989%207.362%200%203.342-1.65%205.204-4.063%205.923v.761c3.597.72%205.713%203.089%205.713%206.897M8.38%2014.977h3.344c2.243%200%203.682-1.016%203.682-3.216s-1.481-3.257-3.724-3.257H8.38zm8.72%207.954c0-2.412-1.82-3.512-4.191-3.512H8.38v7.023h4.698c2.413%200%204.021-1.1%204.021-3.511M37.587%204.442c0%202.454-1.947%204.443-4.359%204.443-2.54%200-4.529-1.989-4.529-4.443S30.685%200%2033.225%200s4.36%201.946%204.36%204.442zM28.95%2031.731V11.423c0-.254.17-.423.423-.423h7.534c.254%200%20.423.17.423.423v20.308c0%20.254-.169.423-.423.423h-7.534c-.254%200-.423-.17-.423-.423m22.817-5.246h7.66c.255%200%20.424.169.424.423v4.823c0%20.254-.17.423-.423.423H41.906c-.254%200-.424-.17-.424-.423v-2.92c0-.211.043-.338.17-.507l8.845-11.296-.423-.423h-8.126c-.254%200-.423-.17-.423-.424v-4.738c0-.254.169-.423.423-.423h17.184c.254%200%20.423.17.423.423v3.723a.74.74%200%200%201-.17.508l-8.04%2010.406zM87.32%2021.45c0%206.685-2.92%2011.17-8.423%2011.17-3.64%200-5.206-2.116-6.01-3.85h-2.285l-1.27%203.045c-.085.254-.254.339-.466.339h-4.782c-.254%200-.424-.127-.424-.423l-.042-28.389c0-.254.17-.423.423-.423h7.534c.254%200%20.423.17.423.423v9.223h.381c.677-.719%202.667-2.242%205.672-2.242%205.968%200%209.269%204.696%209.269%2011.127m-8.211%200c0-3.3-1.735-5.246-4.74-5.246-1.143%200-1.905.17-2.582.38v9.774c.635.211%201.439.38%202.581.38%203.006%200%204.74-1.988%204.74-5.288m25.864-10.788c.593%200%201.27.127%201.82.296.254.084.339.296.339.507v5.712c0%20.254-.127.423-.381.465a99%2099%200%200%200-4.359.889c-2.159.508-3.005%201.861-3.005%204.188v9.012c0%20.254-.17.423-.424.423H91.43c-.254%200-.424-.17-.424-.423V11.423c0-.254.17-.423.424-.423h4.528c.212%200%20.424.085.508.296l1.65%203.046h2.329c.761-2.2%202.031-3.68%204.528-3.68m24.718%208.8V31.73c0%20.254-.169.423-.423.423h-4.825c-.212%200-.381-.085-.466-.296l-1.27-2.666h-2.285c-.974%201.777-2.878%203.427-6.222%203.427-3.894%200-6.433-2.327-6.433-6.05%200-4.569%203.132-6.684%209.057-7.234l4.529-.424v-.169c0-1.777-.973-2.75-2.836-2.75-1.65%200-3.428.212-5.333.55l-1.989.339c-.254.042-.465-.085-.465-.381v-4.696c0-.254.084-.423.296-.466%202.285-.507%205.46-1.015%208.168-1.015%207.28%200%2010.497%203.13%2010.497%209.139m-8.296%202.58-2.031.17c-2.497.211-3.513%201.1-3.513%202.665s1.016%202.285%202.793%202.285c1.143%200%202.116-.17%202.751-.339zm21.459-17.6c0%202.454-1.947%204.443-4.36%204.443-2.539%200-4.528-1.989-4.528-4.443S135.955%200%20138.494%200c2.54%200%204.36%201.946%204.36%204.442m-8.634%2027.289V11.423c0-.254.169-.423.423-.423h7.534c.254%200%20.423.17.423.423v20.308c0%20.254-.169.423-.423.423h-7.534c-.254%200-.423-.17-.423-.423m36.399-13.708v13.708c0%20.254-.17.423-.423.423h-7.534c-.254%200-.423-.17-.423-.423V20.096c0-2.707-1.27-4.104-4.021-4.104-.931%200-1.947.085-2.582.17V31.73c0%20.254-.169.423-.423.423h-7.534c-.254%200-.423-.17-.423-.423V11.423c0-.254.169-.423.423-.423h4.486q.318%200%20.508.254l1.651%202.496h2.37c.762-1.27%202.582-3.3%206.306-3.3%205.122%200%207.619%203.173%207.619%207.573m22.267%207.785c0%204.315-3.386%206.938-9.354%206.938-3.555%200-6.518-.592-8.719-1.185-.211-.042-.338-.211-.338-.465v-4.611c0-.296.169-.424.465-.381%202.286.508%204.867%201.058%206.941%201.058%201.609%200%202.54-.508%202.54-1.608%200-3.258-10.2-1.523-10.285-8.63-.042-4.232%203.174-6.559%209.015-6.559%203.005%200%206.264.593%207.83.973.254.043.381.212.381.466v4.527c0%20.296-.169.423-.466.38-1.946-.338-4.359-.719-6.221-.719-1.228%200-1.947.381-1.947%201.227%200%202.92%2010.158%201.227%2010.158%208.589'/%3e%3c/g%3e%3cdefs%3e%3cclipPath%20id='clip0_9002_89'%3e%3cpath%20fill='%23fff'%20d='M0%200h193v33H0z'/%3e%3c/clipPath%3e%3c/defs%3e%3c/svg%3e)

No maintenance tax
Your suite survives refactors, redesigns, and framework migrations. Engineers stop babysitting brittle scripts and get back to shipping features.
Validate your product's quality with dynamic regression and exploratory tests run by QA agents that act like your customers.
Trusted by high-performing engineering teams at:


'%3e%3cpath%20fill='%234d4e50'%20d='M80.727%202.097c.925.107%201.878.296%202.804.512%201.772.432%203.413%201.24%204.947%202.292.424.296.477.566.238%201.025-.9%201.671-1.772%203.342-2.672%205.014-.317.593-.476.62-1.005.216-1.56-1.214-3.255-2.023-5.212-2.13-3.281-.19-5.795%201.213-7.383%204.125-1.825%203.37-1.72%206.793.212%2010.083%201.88%203.208%205.186%204.475%208.864%203.558%201.323-.323%202.54-.943%203.65-1.725.584-.404.715-.378%201.033.216.846%201.59%201.693%203.208%202.54%204.8.317.592.291.7-.265%201.077-2.962%202.049-6.217%202.939-9.79%202.831-7.725-.216-14.234-6.228-15.16-14.047-.979-8.491%204.498-16.094%2012.78-17.63.528-.109%201.058-.162%201.586-.243.953-.08%201.826-.108%202.806%200l.026.027zM42.942%2022.155c.794%201.429%201.561%202.804%202.328%204.206%201.138%202.049%202.25%204.071%203.388%206.12.396.728.236.997-.582.997h-5.822c-.688%200-1.164-.242-1.51-.863-2.434-4.61-4.893-9.192-7.328-13.775-.026-.055-.052-.133-.132-.325h3.07c.528%200%201.057-.107%201.586-.215%201.774-.432%202.937-1.968%202.99-3.963.08-2.534-1.164-4.098-3.625-4.584a6%206%200%200%200-1.19-.134h-2.963v22.97c0%20.863-.054.916-.927.916h-6.006c-.741%200-.846-.107-.846-.836V3.527c0-.755.08-.836.793-.836h9.87c1.772%200%203.519.189%205.265.62%203.863.97%206.032%203.586%206.826%207.44.423%201.996.37%203.991-.265%205.932-.688%202.13-1.957%204.071-4.921%205.5zM7.726%2023.692v8.898c0%20.646-.08.727-.714.727H.687c-.608%200-.687-.081-.687-.702V3.204C0%202.608.106%202.5.635%202.5c3.968%200%207.91%200%2011.88.108a14.3%2014.3%200%200%201%203.546.54c3.043.808%205%202.884%206.032%205.822%201.27%203.56.874%207.01-1.032%2010.22-1.429%202.425-3.704%203.692-6.403%204.205-2.063.377-4.128.268-6.19.296zm.026-14.235v7.28h3.942c.424%200%20.874-.109%201.27-.217%201.588-.43%202.382-1.563%202.382-3.316%200-1.833-.742-2.937-2.355-3.396-1.72-.485-3.466-.27-5.239-.324zm92.157.134v4.746h7.592c.688%200%20.794.107.794.81v5.39c0%20.62-.106.728-.741.728h-7.646v5.258h8.521c.794%200%20.846.053.846.863v5.337c0%20.593-.132.729-.687.729H92.791c-.608%200-.688-.135-.688-.837V3.31c0-.593.106-.674.688-.674h15.849c.555%200%20.661.108.661.702v5.391c0%20.728-.079.837-.793.837h-8.572zm-39.742%208.52v14.532c0%20.782-.08.862-.873.862h-6.06c-.74%200-.846-.08-.846-.862V3.5c0-.755.053-.81.794-.81h6.165c.741%200%20.793.055.793.81v14.639zm70.91%204.044c.794%201.429%201.561%202.804%202.328%204.206%201.138%202.049%202.249%204.071%203.387%206.12.397.728.238.997-.582.997h-5.821c-.688%200-1.164-.242-1.508-.863-2.434-4.61-4.895-9.192-7.329-13.775a3%203%200%200%201-.132-.325h3.068c.53%200%201.059-.107%201.588-.215%201.773-.432%202.937-1.968%202.99-3.963.079-2.534-1.164-4.098-3.625-4.584a6%206%200%200%200-1.19-.134h-2.964v22.97c0%20.863-.053.916-.926.916h-6.006c-.741%200-.847-.107-.847-.836V3.527c0-.755.079-.836.794-.836h9.869c1.773%200%203.519.189%205.265.62%203.864.97%206.033%203.586%206.827%207.44.424%201.996.37%203.991-.264%205.932-.689%202.13-1.959%204.071-4.922%205.5z'/%3e%3c/g%3e%3cdefs%3e%3cclipPath%20id='clip0_6040_2476'%3e%3cpath%20fill='%23fff'%20d='M0%200h137v34H0z'/%3e%3c/clipPath%3e%3c/defs%3e%3c/svg%3e)


'%3e%3cpath%20d='M26.15.58C14.49%201.37%203.33%2010.49.12%2021.86c-.35%201.15.11%201.54%201.19%201.54h5.16c.64%200%201.01-.2%201.19-.89%201.38-5.04%205.1-9.43%209.72-11.99.81-.47%201.71-.68%201.49.52l-.23%201.12c-.17%203.62%207.5.45%207.97-2.02%200%200%20.72-3.67.83-8.09%200-1.1-.42-1.48-1.14-1.48h-.16'/%3e%3cpath%20d='M42.88%202c-.19%206.64-1.65%2013.7-4.39%2020.44-.24.59-.45.97-1.33.97h-5.05c-.81%200-1.5-.06-.96-1.46.58-1.5%202.08-5.42%202.83-9.06.14-.71-.18-1.31-1.03-.56l-4.98%204.44c-3.13%202.79-6.8%202.23-8.35.69s-1.39-3.46-.72-6.47c-.32%202.23%203.74%202.71%206.61.15l11.2-9.99c.6-.53.99-.63%201.65-.63h3.31c.93%200%201.23.58%201.21%201.47zm18.7%2012.19h-.51l-4.4-5.95v9.94h-2.61V4.51h3l4.32%205.88%204.32-5.88h2.98v13.67h-2.61V8.26l-4.5%205.93zm14.13%202.09c.89%200%202.03-.33%202.61-.9l1.54%201.5c-1.05%201.04-2.68%201.56-4.18%201.56-3.35%200-5.35-2.07-5.35-5.13s2.01-5.04%205.17-5.04c2.98%200%204.95%201.7%204.95%205.06%200%20.29-.02.59-.04.9h-7.6c.16%201.19%201.18%202.05%202.9%202.05m-.14-5.89c-1.32%200-2.35.63-2.72%201.87h5.25c-.16-1.25-1.13-1.87-2.53-1.87m11.11%205.89c.89%200%202.03-.33%202.61-.9l1.54%201.5c-1.05%201.04-2.68%201.56-4.18%201.56-3.35%200-5.35-2.07-5.35-5.13s2.01-5.04%205.17-5.04c2.98%200%204.95%201.7%204.95%205.06%200%20.29-.02.59-.04.9h-7.6c.16%201.19%201.18%202.05%202.9%202.05m-.14-5.89c-1.32%200-2.35.63-2.72%201.87h5.25c-.16-1.25-1.13-1.87-2.53-1.87m9.79-1.8h2.68v2.05h-2.7v4.24c0%20.92.49%201.37%201.26%201.37.37%200%20.79-.12%201.16-.29l.67%202.03c-.75.31-1.36.41-2.19.41-2.01%200-3.3-1.17-3.3-3.51v-4.24h-1.82V8.6h1.82V6.08l2.41-.25V8.6zm5.41-4.16c.71%200%201.42.47%201.42%201.39s-.71%201.39-1.42%201.39-1.42-.45-1.42-1.39.71-1.39%201.42-1.39m1.21%2013.72h-2.41V8.5h2.41v9.66zm9.32-5.09c0-1.46-.83-2.58-2.35-2.58s-2.49%201.23-2.49%202.69v4.98h-2.39V8.53h2.15l.16%201.23c1.01-1.07%201.95-1.44%203.2-1.44%202.29%200%204.12%201.7%204.12%204.72v5.12h-2.41v-5.1zm14.51-4.18-1.22%201.41c.85%201%201.12%201.87%201.12%202.87%200%201.72-.81%202.89-2.41%203.61%202.05.72%202.41%202.19%202.41%203.12%200%202.73-2.7%204.06-5.31%204.06-3.38%200-5.35-1.68-5.25-4.43h2.39c-.1%201.33%201.34%202.13%202.86%202.13%201.34%200%202.8-.57%202.8-1.76s-.95-1.89-2.76-1.89c-3.22%200-5.33-1.81-5.33-4.84%200-3.24%202.61-4.88%205.33-4.88.75%200%201.83.16%202.51.61L125%207.56l1.78%201.33zm-8.29%204.28c0%201.68%201.34%202.66%202.92%202.66s2.86-1.02%202.86-2.66-1.28-2.67-2.86-2.67-2.92.88-2.92%202.67m12.61%205h-2.61V4.49c2.15%200%204.36-.02%206.51-.02%203.39%200%205.09%202.4%205.09%204.8s-1.7%204.82-5.09%204.86h-3.91v4.02zm3.91-6.38c1.66%200%202.49-1.21%202.49-2.42s-.83-2.42-2.49-2.42h-3.91v4.84zm16.12-3.25v9.62h-2.27l-.12-1.41c-.57%201.13-2.05%201.7-3.16%201.7-2.9%200-5.01-1.74-5.01-5.11s2.23-5.04%205.07-5.04c1.32%200%202.54.61%203.1%201.56l.08-1.33h2.31zm-8.15%204.8c0%201.83%201.28%202.93%202.88%202.93%201.89%200%202.84-1.46%202.84-2.93s-.95-2.91-2.84-2.91c-1.6%200-2.88%201.07-2.88%202.91m14.86%205.12c-2.82%200-5.17-1.66-5.17-5.06s2.35-5.1%205.17-5.1c1.4%200%202.43.39%203.51%201.42l-1.52%201.58c-.57-.53-1.26-.76-1.95-.76-1.64%200-2.8%201.17-2.8%202.85%200%201.83%201.26%202.77%202.76%202.77.77%200%201.52-.2%202.13-.8l1.62%201.56c-1.12%201.09-2.31%201.52-3.75%201.52zm7.3-6.05%203.28-3.86h2.88v.14l-3.97%204.39%204.52%204.92v.18h-2.9l-3.81-4.35v4.35h-2.41V4.51h2.41z'/%3e%3cpath%20d='M182.1%208.53v9.62h-2.27l-.12-1.41c-.57%201.13-2.05%201.7-3.16%201.7-2.9%200-5.01-1.74-5.01-5.11s2.23-5.04%205.07-5.04c1.32%200%202.55.61%203.1%201.56l.08-1.33h2.31zm-8.15%204.8c0%201.83%201.28%202.93%202.88%202.93%201.9%200%202.84-1.46%202.84-2.93s-.95-2.91-2.84-2.91c-1.6%200-2.88%201.07-2.88%202.91m20.38-4.45-1.22%201.41c.85%201%201.12%201.87%201.12%202.87%200%201.72-.81%202.89-2.41%203.61%202.05.72%202.41%202.19%202.41%203.12%200%202.73-2.7%204.06-5.31%204.06-3.38%200-5.35-1.68-5.25-4.43h2.39c-.1%201.33%201.34%202.13%202.86%202.13%201.34%200%202.8-.57%202.8-1.76s-.95-1.89-2.76-1.89c-3.22%200-5.33-1.81-5.33-4.84%200-3.24%202.6-4.88%205.33-4.88.75%200%201.83.16%202.51.61l1.09-1.33%201.78%201.33zm-8.29%204.28c0%201.68%201.34%202.66%202.92%202.66s2.86-1.02%202.86-2.66-1.28-2.67-2.86-2.67-2.92.88-2.92%202.67m14.66%203.12c.89%200%202.03-.33%202.61-.9l1.54%201.5c-1.05%201.04-2.68%201.56-4.18%201.56-3.35%200-5.35-2.07-5.35-5.13s2.01-5.04%205.17-5.04c2.98%200%204.95%201.7%204.95%205.06%200%20.29-.02.59-.04.9h-7.6c.16%201.19%201.18%202.05%202.9%202.05m-.14-5.89c-1.32%200-2.35.63-2.72%201.87h5.25c-.16-1.25-1.12-1.87-2.53-1.87'/%3e%3c/g%3e%3cdefs%3e%3cclipPath%20id='clip0_9002_63'%3e%3cpath%20fill='%23fff'%20d='M0%200h206v24H0z'/%3e%3c/clipPath%3e%3c/defs%3e%3c/svg%3e)
QA.tech is an AI testing solution that gives you continuous validation across your SDLC. From PR checks to production runs, our agents monitor every commit. Accelerate your release cycle without compromising your standards.
The Rise of Product Excellence. Read our Vision manifest →
Works with
 Web
Web Mobile web
'%3e%3cpath%20fill='%23fff'%20d='M25.12%2020.98c-.747%200-1.902-.85-3.12-.82-1.606.022-3.079.932-3.907%202.375-1.667%202.894-.43%207.17%201.197%209.522.798%201.146%201.739%202.434%202.986%202.394%201.198-.051%201.647-.777%203.1-.777%201.442%200%201.851.777%203.12.746%201.289-.02%202.107-1.165%202.895-2.322a10.3%2010.3%200%200%200%201.309-2.69c-.031-.01-2.507-.961-2.537-3.825-.02-2.395%201.954-3.54%202.046-3.591-1.126-1.646-2.854-1.83-3.458-1.872-1.575-.123-2.895.86-3.631.86m2.66-2.415c.665-.798%201.104-1.912.981-3.017-.95.04-2.096.634-2.782%201.432-.614.706-1.145%201.841-1.002%202.925%201.054.082%202.138-.542%202.803-1.34'/%3e%3c/g%3e%3cdefs%3e%3cclipPath%20id='clip0_1186_173'%3e%3cpath%20fill='%23fff'%20d='M15.549%2015.548h18.904v18.904H15.549z'/%3e%3c/clipPath%3e%3c/defs%3e%3c/svg%3e) iOS Apps
iOS Apps'%3e%3cpath%20fill='%23fff'%20d='m30.073%2019.927-1.597%202.755-.087-.034a9.53%209.53%200%200%200-6.837.026c-.066-.117-1.38-2.38-1.593-2.746a.87.87%200%201%200-1.503.872c1.534%202.655-.076-.17%201.534%202.646.014.025-.39.208-1.097.802-1.06.89-2.988%202.936-3.344%206.258h18.904a9.2%209.2%200%200%200-.588-2.417%209.53%209.53%200%200%200-3.837-4.624c.52-.884%201.034-1.777%201.548-2.666a.87.87%200%200%200-.29-1.173.9.9%200%200%200-.387-.129c-.411-.042-.74.247-.826.43m-.03%206.664c.31.467.255%201.048-.124%201.3-.378.252-.936.078-1.246-.39-.31-.466-.255-1.047.123-1.3.373-.247.93-.085%201.246.39m-8.817-.388c.378.252.433.833.123%201.3s-.87.641-1.248.39c-.378-.252-.433-.834-.123-1.3.316-.475.873-.64%201.248-.39'/%3e%3c/g%3e%3cdefs%3e%3cclipPath%20id='clip0_1186_176'%3e%3cpath%20fill='%23fff'%20d='M15.549%2015.548h18.904v18.904H15.549z'/%3e%3c/clipPath%3e%3c/defs%3e%3c/svg%3e) Android Apps
Android AppsShip features, not test suites. Engineers focus on building. Agents handle the validation.
Trust feedback, don't chase flakes. Get certain results on every PR instead of debugging unstable automation.
Make deploys boring. Replace high-stress release scrambles with a predictable validation layer.
Your suite survives refactors, redesigns, and framework migrations. Engineers stop babysitting brittle scripts and get back to shipping features.
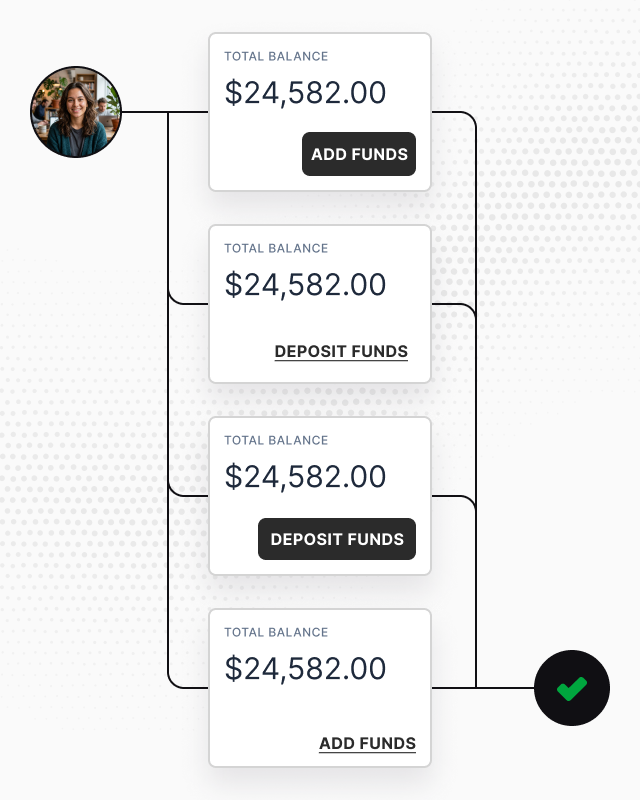
Agents see your UI the way a user does – no selectors, no scripts. They work towards goals, not steps, so tests adapt as your product evolves.
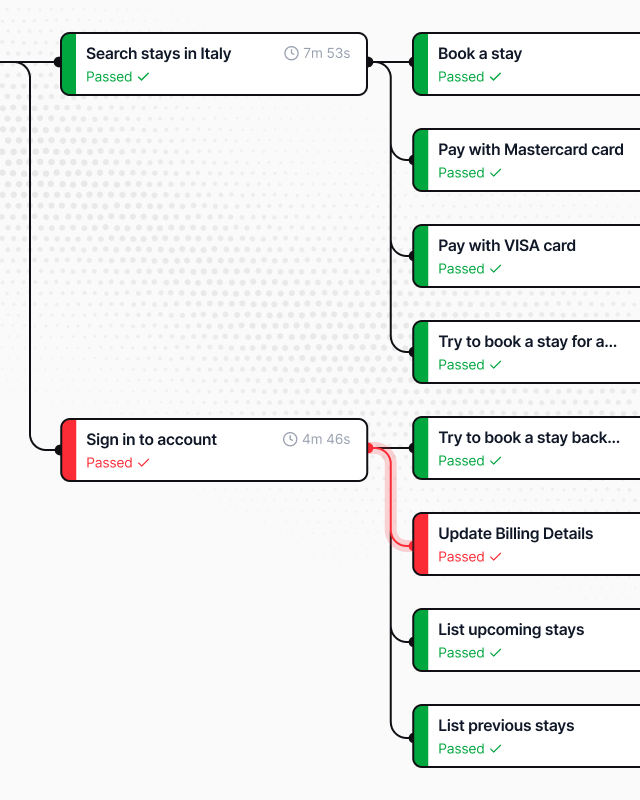
From PR to production, agents run continuously – catching regressions before merge, validating deploys, exploring edge cases on a schedule.
"We have replaced over 320h of manual testing every month with QA.tech."

Describe flows, edge cases, and domain rules in chat. Every briefing adds to what agents know and sticks across every run that follows.

Connect GitHub and agents pick up every PR with its Vercel preview. QA.tech automatically runs dynamic tests and gives you fast feedback with failure breakdowns, screenshots, and explanations.

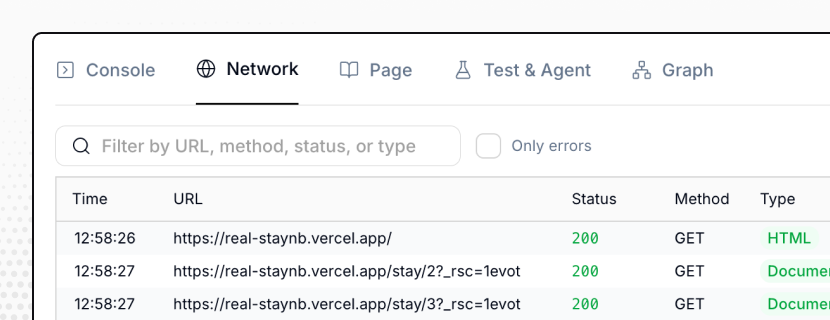
Screenshots, logs, and network activity for every step – plus the agent's reasoning at the point of failure. No guessing what broke. Time to root cause drops from hours to minutes.
QA spend comparison (36 months)
Estimated using typical QA salaries and team setups

"Pricer saves 390h of testing each quarter."
Our agents run entirely in our secure cloud. Point them at your environment and begin validating – no infrastructure to manage.
QA.tech tests your product without touching your code. Skip the lengthy approval process and start testing in minutes.
SOC 2 Type 2 compliant, with SSO and SAML. Your data stays private and is never used to train models.
React, Vue, native mobile – QA.tech is framework-agnostic. No stack change forces a rewrite.
QA.tech agents test your product autonomously, so moving fast never means shipping broken. See how it works in a 30-minute demo.